Artists Express with Data
|
|
what is data ? It’s facts, figures or information. Data can reveal a bigger thought.
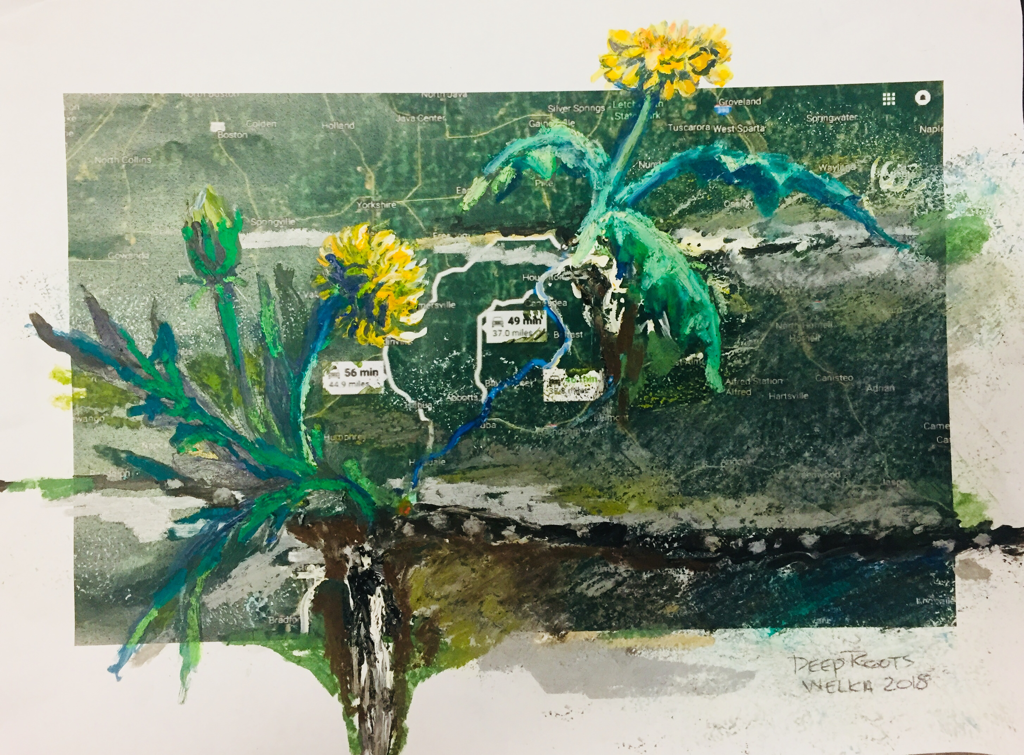
Data In this case is the distance, time, and roads between two people.
I had reconnected through DNA testing the discovery of a full blooded sister. The data that she was so close distance from me during our childhood became the focus of my art. I showed my mind map in thinking in the photo. I printed off a google map and began my artwork on it. I thought dandelions grow wherever they are planted and thrive to represent us. They have deep roots, which I had connect on the map roads. How could you use maps real or imaginary to show your location, direction, or orientation?
Looking at Data reveals patterns which help us understand our world.
Einstein visualized himself riding a beam of light. He visualized in his development of theories. Math for him was the connection between the universe and man. Scientists and mathematician as well as artists look for definable patterns in the world to better understand it ! We can read the patterns to read the language of the universe. By looking at data we can find patterns. . Article
h. Astrologists look at the pattern of the sky on the day you were born as telling something about your nature. Numerologist. Look at your birth date and the personality type of the number that represents you. All in an attempt to personably relate to the universe.
How could you be fascinated by the science or math behind something. Could you use a diagram, spiral, or formula written on it.
Alan Turing, the prolific mathematician best known for helping to break the Enigma code at Bletchley Park during the Second World War, and for writing a scientific paper that would form the basis for modern computing – was not content with simply marvelling at the miracle of nature. He studied how emerging chemicals under the skin create a mathematically definable pattern. This pattern formula became known as the Turing Effect that can also be used to describe patterns in wind blown sand as well as criminal hit spots. It is the pattern of push and pull whether it’s chemical, physical or social. Article
Visual Data
started in the Renaissance
Mathematicians look at the patterns of how things were created in the spiral of a sunflower or shell creating the Golden Mean. It was thought to be the formula in Gods recipe of creation. Fibonacci numbers are a pattern of numbers that define a perfect spiral. The spiral isvisual data of Fibonacci s number patterns.
Spirals can be found in the shape of DNA double helix, flowers, elephant tusks, sunflowers, hurricanes, draining water, horns of animals, a nautilus shell, a snail shell, a pinecone, a cabbage, a fingerprint, algeas, galaxies. Tons of lifeless and alive things have spiral designs. And they are not random spirals. They have something in common: the ubiquitous constant ratio, the golden ratio! A surprisingly this golden ratio probably is also a property of space-time. (Medium.com)
Spirals can be found in the shape of DNA double helix, flowers, elephant tusks, sunflowers, hurricanes, draining water, horns of animals, a nautilus shell, a snail shell, a pinecone, a cabbage, a fingerprint, algeas, galaxies. Tons of lifeless and alive things have spiral designs. And they are not random spirals. They have something in common: the ubiquitous constant ratio, the golden ratio! A surprisingly this golden ratio probably is also a property of space-time. (Medium.com)
DaVinci’s Vitruvius Man. The proportions of man. The drawing is based on the ideal human proportions with geometry described by architect and first-known engineer, Vitruvius, it gives mans proportions. The belly is the center. It shows man as the center of the universe
|
|

No matter which direction you count the spirals going they will always add up to a Fibonacci number.
|
Fibonacci DayNovember 23. Also written as 11 23. Get it. 1+1=2, 2+1=3. Facebook lights up on this day.
Fibonacci Day Epiphany Appleseed@FunkyAppleTree
Knock Knock Knock knock Knock knock knock Knock knock knock knock knock "Who's there?" "Fibonacci"#FibonacciDay |
Visual Data Field
|
|
|
Challenge: Making data more Personal
TED talk
Giorgia Lupi | TED Speaker
Giorgia Lupi sees beauty in data. She challenges the impersonality that data communicate, designing engaging visual narratives that re-connect numbers to what they stand for: stories, people, ideas.
Information designer
https://www.ted.com/speakers/giorgia_lupi
Giorgia Lupi sees beauty in data. She challenges the impersonality that data communicate, designing engaging visual narratives that re-connect numbers to what they stand for: stories, people, ideas.
Information designer
https://www.ted.com/speakers/giorgia_lupi
HOW CAN YOU USE DATA IN YOUR ART?
|
How will your data support your message?
How will you organize this information (look at Matt Shirley and Pinterest) Do you need real data or imaginary? You need to start small. Then see where it takes you! Matt Shirley
|
Essential QuestionsWhat do you want to say with your art.
Consider the ten themes (Ian Sands) such as identity, and activism Data about your identity: Bullet Journals: places you want to visit, favorite song lyrics, collection of ideas/thoughts/dreams Mood trackers: track your moods with a color key to create pixel art. Time committed Number of times you do something in an hour-check your phone, twirl your hair, think about a loved one, look at the clock, homework, makeup, working out, riding a bus, watching Numbers Important dates, GPS of your home or favorite places, distance from one place to another, number of people in your family, How are numbers in your world. How about a graph of milestones in your life. Use a count down, top ten, lists Activism: What do you feel strongly about and what data can you find. For example Supersize me looks at McDonald’s effects. Whats your our pet peeve? |
www.dna11.com/images-gallerylip prints, dna results, and fingerprints are made into personalized art
Visualize data from sound
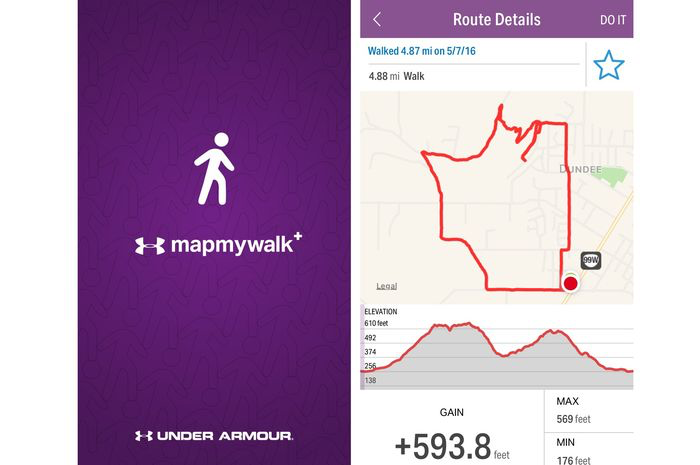
Ideas: gps trail favorite route to walk a bike through town, family trips taken, flight paths and airplanes taken, contour maps of your town or hill, use of latitude and longitude in places of importance, use of the map itself under a drawing of importance.
Visualize data from Maps
Maps have a sense of discovery . They orientate us to where we are. They can involve maps of happenings in the world such as wats, famine, trade, education. Look at the make of the stars on the day you were born. Imagination can be mapped out to show many personal themes such as directions in your life, your world. Maps
The art of maps
topographic map resource
star maps for different days
Mark Bradford Cerberus
Used information gathered in a government report about the Watts Riots. He created a map based on the data in that report as how different areas of the city were affected
phil in the circle
Green River Killer
Gather your own data
Morgan Shurlock documented the effects of fast food on his body by only eating fast food for 30 days. He went to the doctor who gathered data on health effects.
